Eta Meson
Determining the η Cross Section
The following is a brief overview of the analysis step used to calculate the cross section for the η meson in the 2γ final state Radphi dataset. While this analysis is specific to the Radphi detector dataset, many of the techniques are common in the nuclear/particle physics field and are useful in other experiments such as GlueX. These analysis wiki pages, while serving as an additional archive for my analysis, are mainly intended to serve as a tutorial for future graduate students. This work uses the Radphi pass-9-2020 dataset, which contains 2,578 individual ROOT format files. These files are located at /pnfs4/phys.uconn.edu/data/Gluex/radphi/pass-9-2020 . The pass-6-2014 dataset was used for Fridah Mokaya's analysis of the ω meson. The pass-6-2014 dataset used an algorithm designed by Fridah to merge Lead-Glass Detector (LGD) photon hits. While this algorithm was helpful in lower number photon final states such as the 3γ dataset used for: ω → πo·γ & ω → η·γ where πo, η → 2γ; it had an adverse effect on higher photon multiplicity final states.
An Excel spreadsheet has been created to calculate the location of the bundle supports' mounting rods with respect to the focal plane coordinate system. This spreadsheet also calculates the length of the parallel railing end supports which need to be fabricated anew for each unique TAGM location on the focal plane. One last, but very important thing that the spreadsheet calculates is the shim size needed, during TAGM realignment, in order to achieve the proper tow angle between bundle supports during mounting. In addition to the spreadsheet, an AutoCAD drawing used to design the three parallel rail components needed for each unique tagging energy spectrum starting position of the TAGM and a drawing for the current setup (β = 12.5o to 11.06o). These files are in US standard units (inches) and to scale with a tolerance of ± 0.001 inch.
A summary of the spreadsheet calculations is a follows:
- Select a starting energy for the photon tagging array (highest γ energy to tag)
- Using hodoscope energy bin bounds interpolate the crossing angle with respect to the focal plane (β1) of an electron associated the highest energy to be tagged (Eγo)
- Interpolate the location on the XFP axis at which this electron crosses (X1)
- These electrons will pass through the center of the first column of SciFi fibers
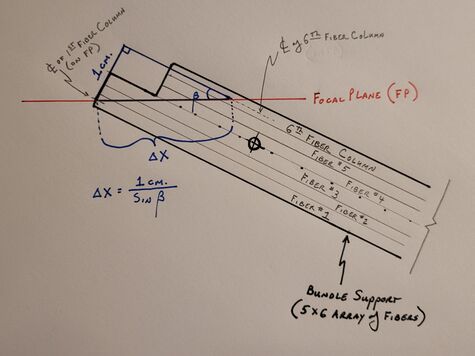
- Using β1 calculate the X-displacement along the focal plane (Δx) from the center of the first fiber column to the center of the sixth fiber column of the first bundle support
- Add Δx and X1 to get X6, then interpolate the value of β6
- Using the average value of β1 and β6 (βavg.), recalculate the XFP displacement (Δx) from the center of the first to sixth fiber column (X6)
- Repeat the above two steps until the bundle support angle β (e.g. average between β1 & β6) does not change appreciably
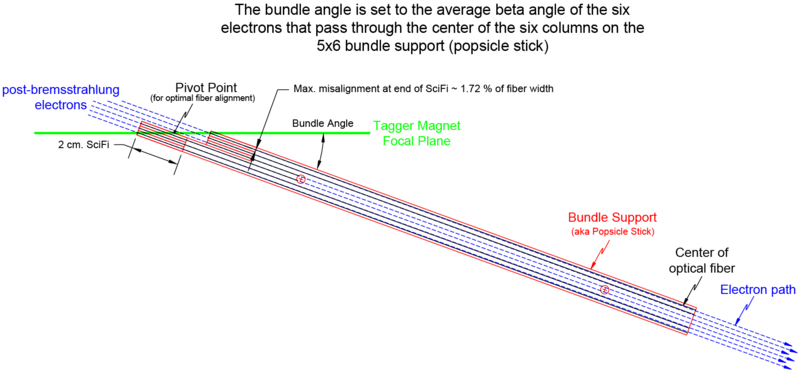
Now we know the focal plane crossing locations for the center of the first and sixth SciFi columns in our first bundle, as depicted in Figure 1 by the endpoints of Δx. Additionally, we know the β angle of the first bundle (noted as βavg above), which gives us the optimal alignment for each fiber in the bundle to their respective electron's path. The β angles for the first and sixth columns will be off by the same magnitude, but with opposite signs.

