Difference between revisions of "Temperature Data from Fiber Heating"
| Line 86: | Line 86: | ||
[[File:BWFansOnLate7272015.png]] | [[File:BWFansOnLate7272015.png]] | ||
| + | The test thermistor was at the front left end. | ||
[[File:BWThermistors7272015.png]] | [[File:BWThermistors7272015.png]] | ||
| − | + | The test thermistor was at the middle right end. This run began immediately after the previous run ended, and the box did not completely cool. | |
Latest revision as of 22:00, 25 August 2015
Data Files
We will make available raw spreadsheet data files and edited files that include charts and summary information.
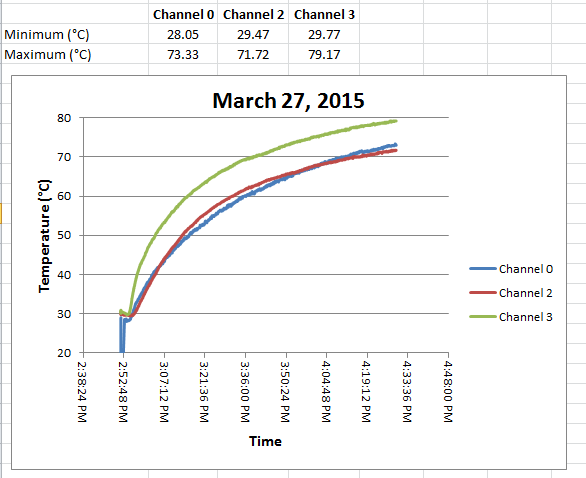
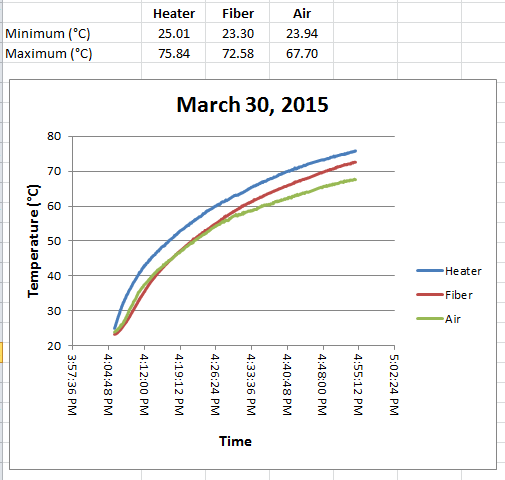
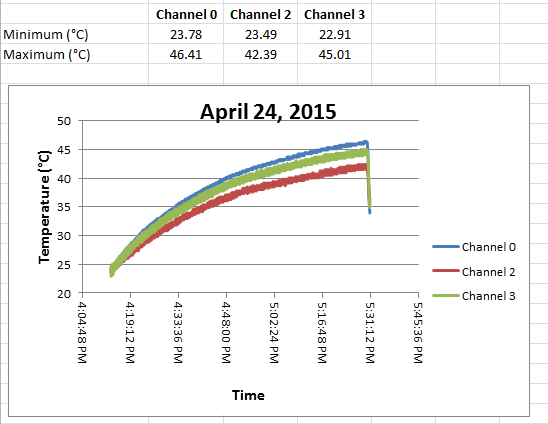
Data From Three Thermistors
March 27, 2015
March 30, 2015
April 24, 2015
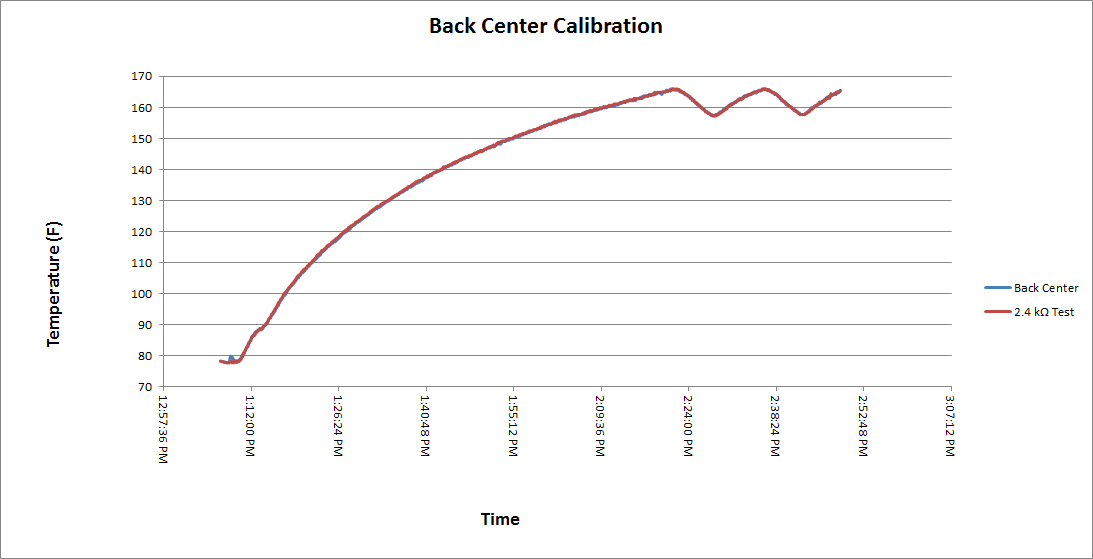
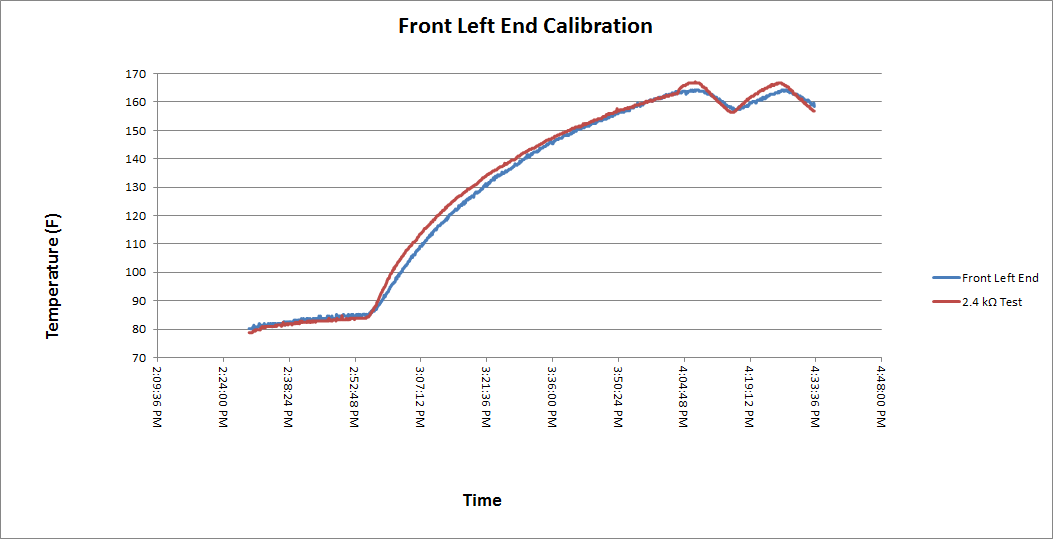
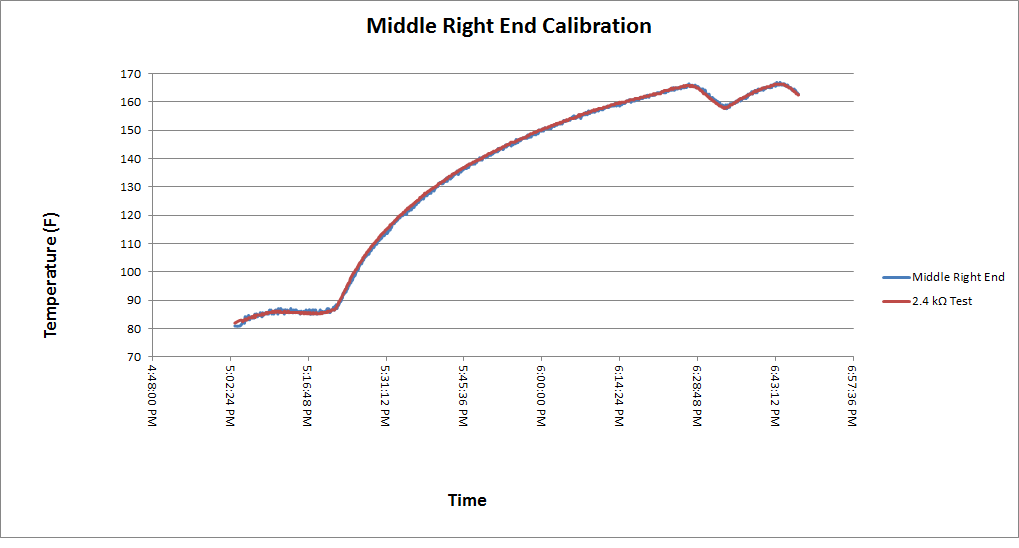
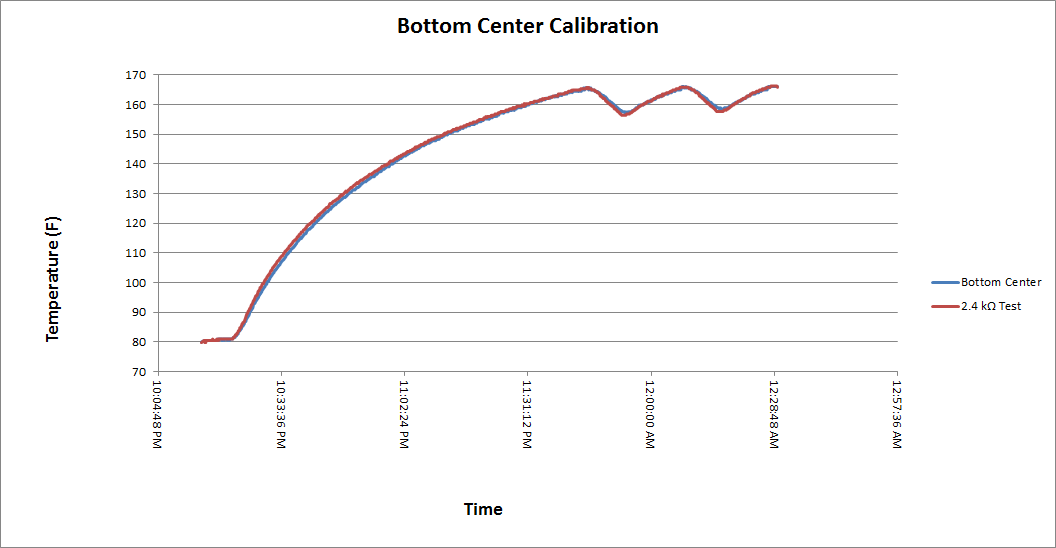
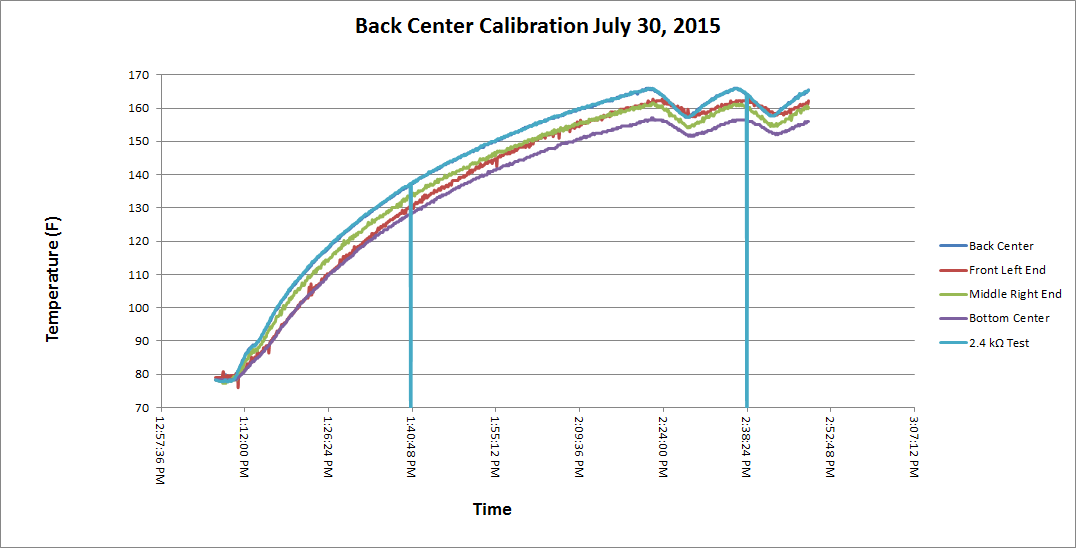
Calibration Graphs for Four Thermistors
The adjusted variables for the thermistor temperature formula are shown below each calibration graph.
Back Center
Front Left End
Middle Right End
Bottom Center
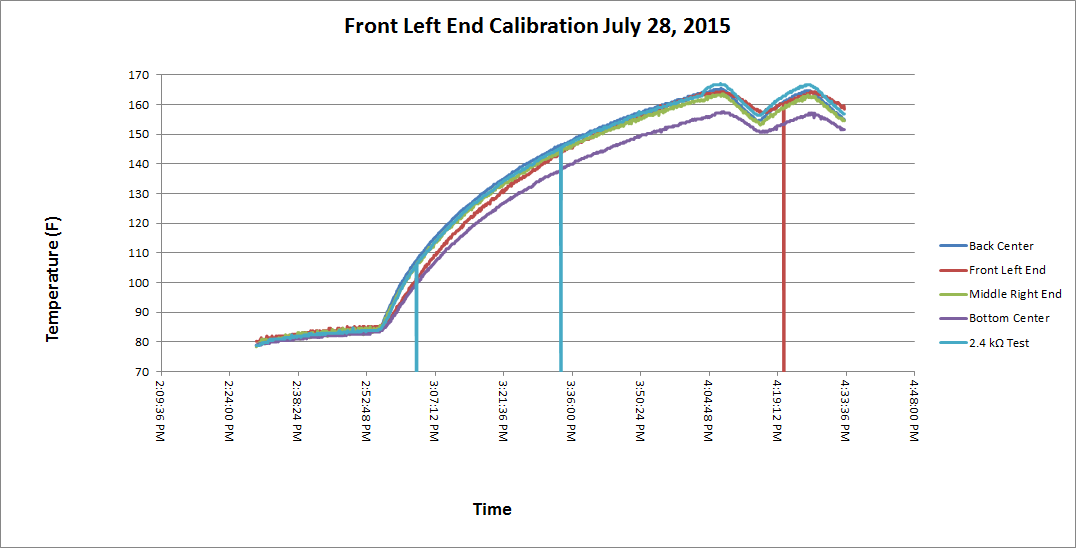
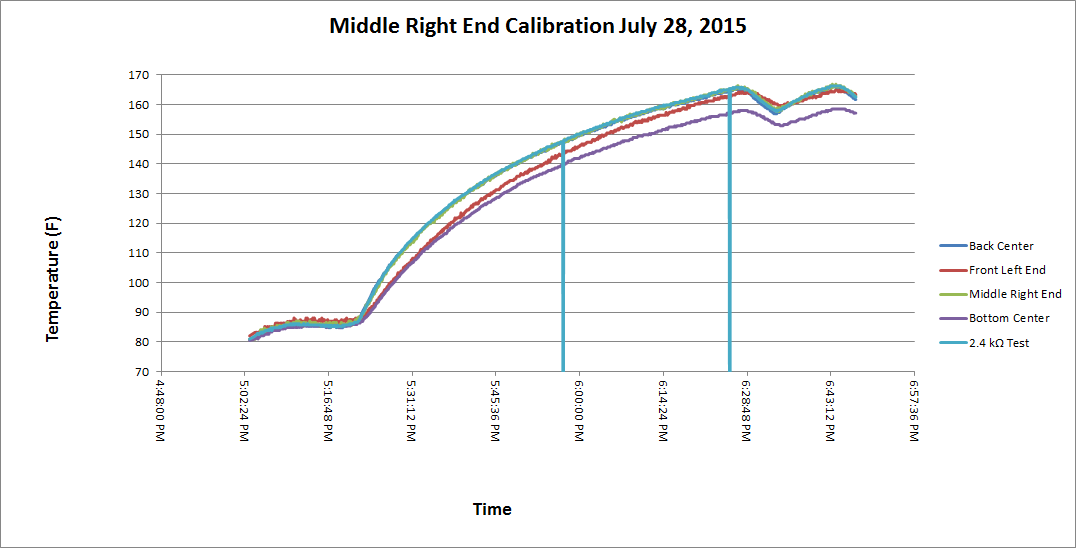
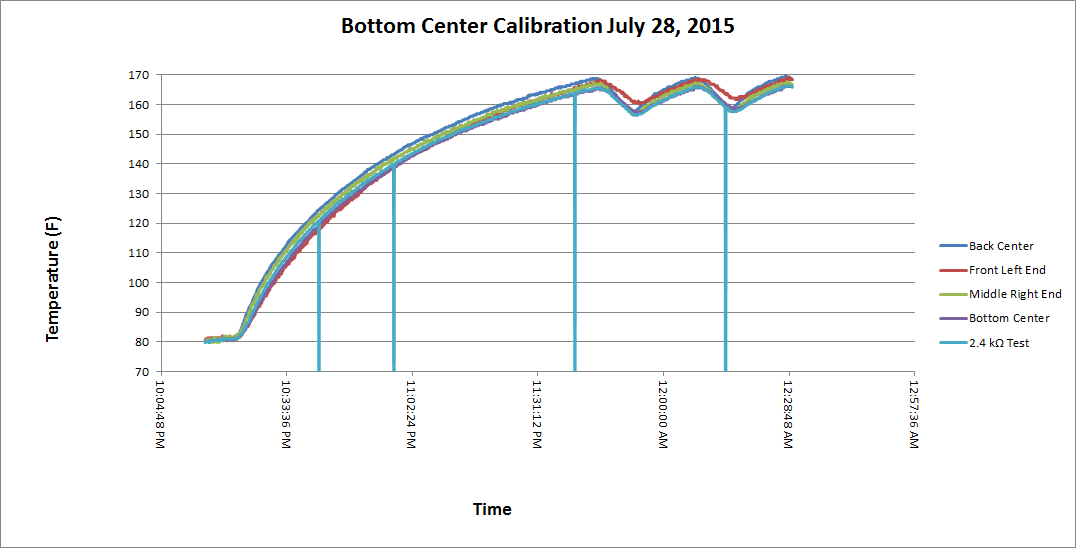
All Temperature Data from Calibration Tests
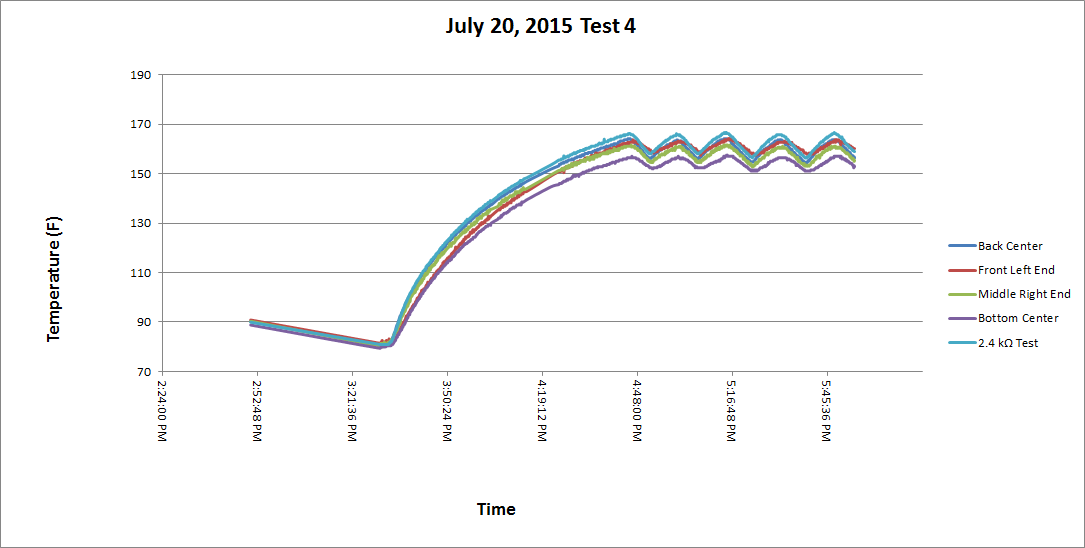
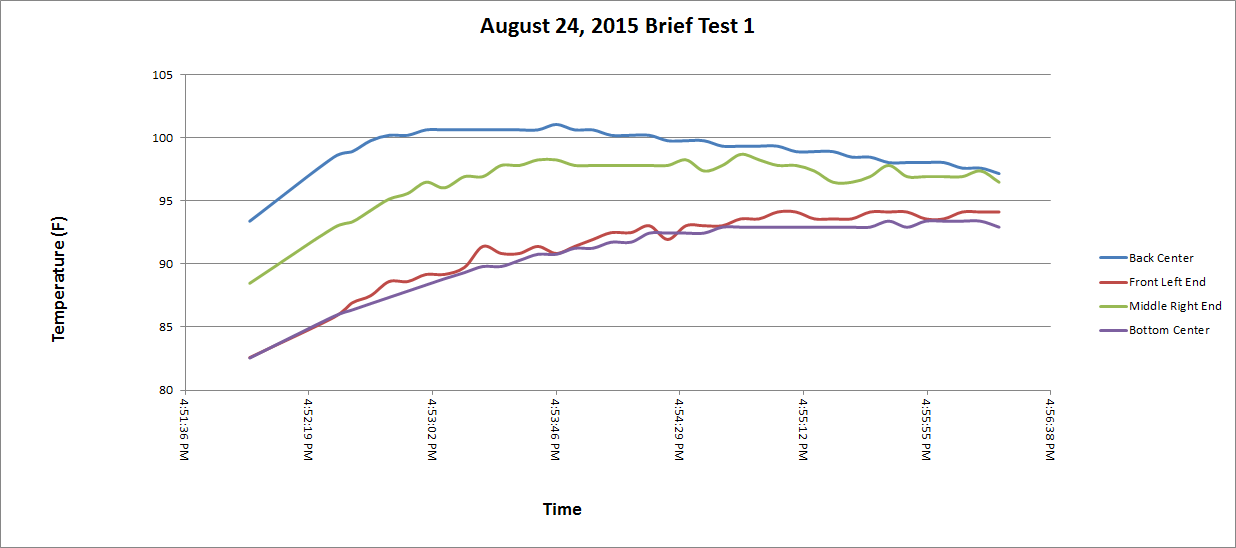
These graphs display temperature data from all thermistors during the calibration runs.
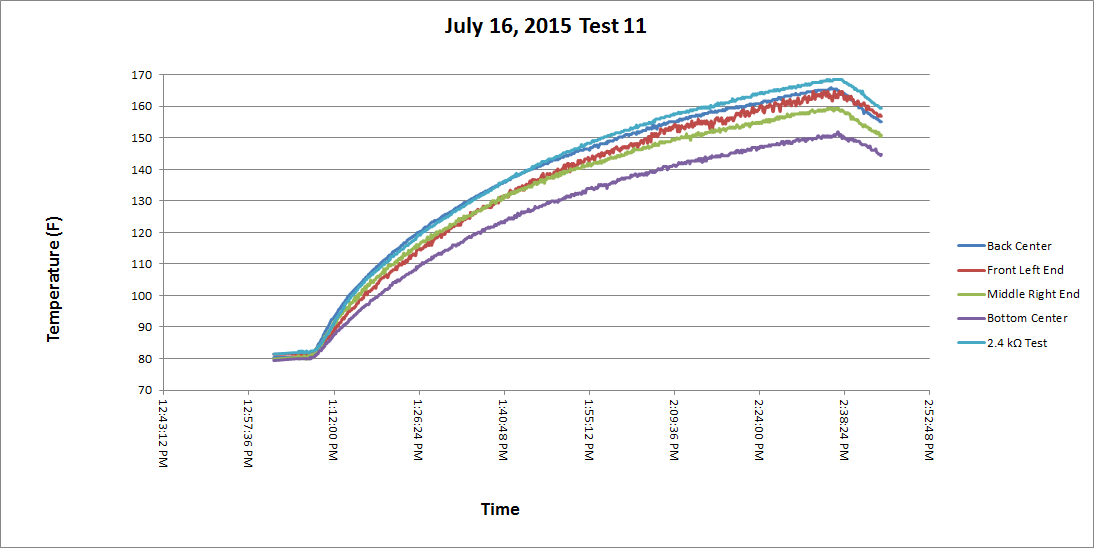
Other Tests
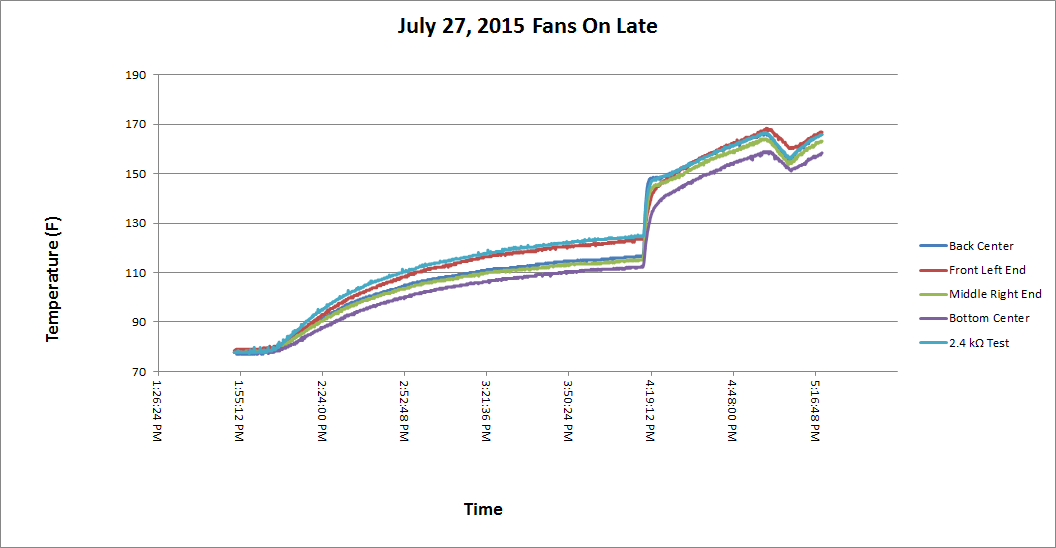
The test thermistor was at the front left end.
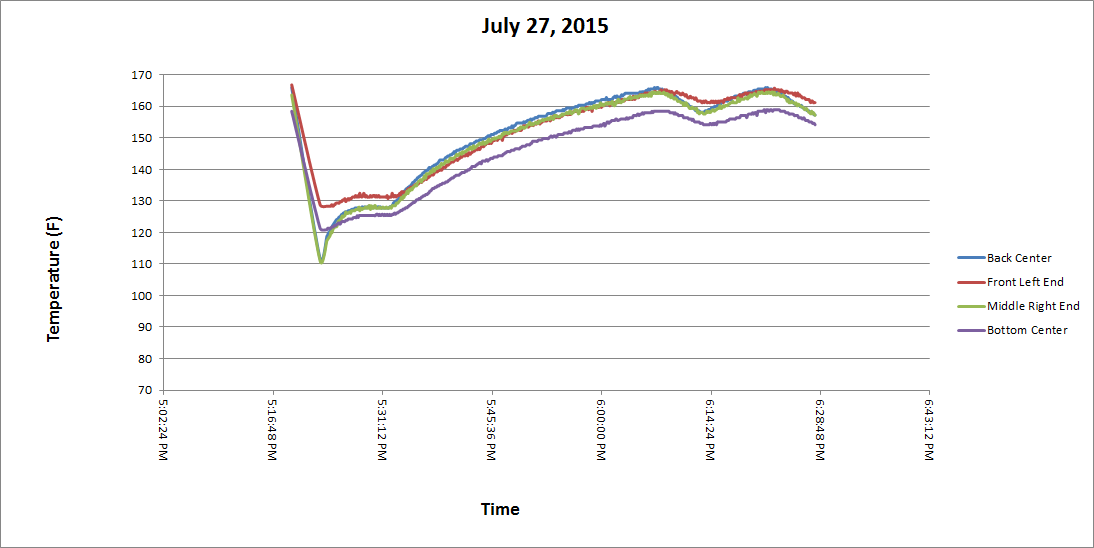
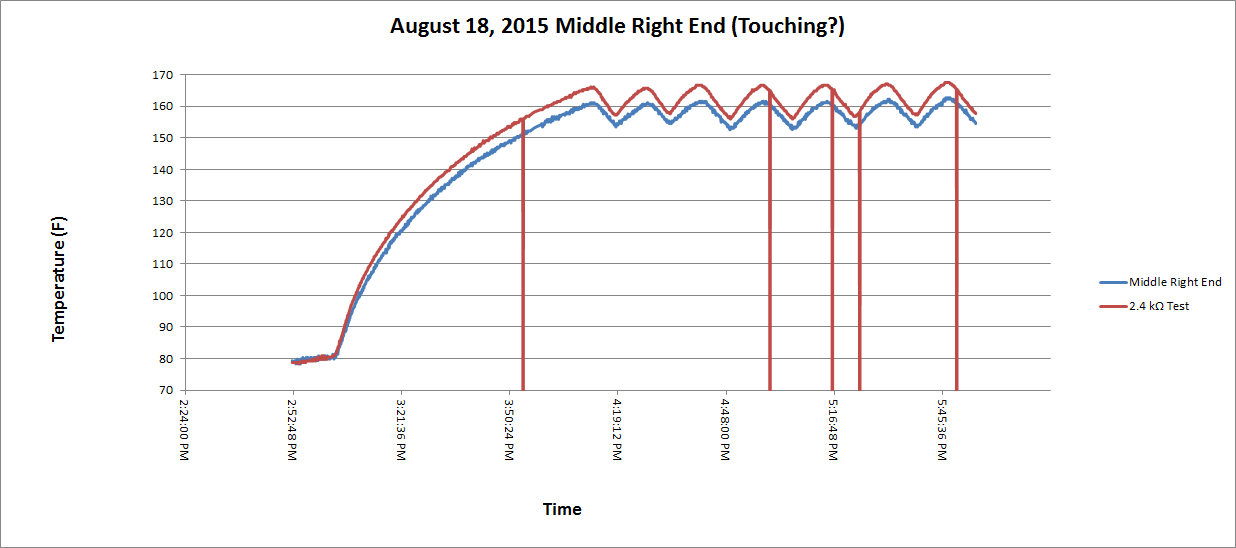
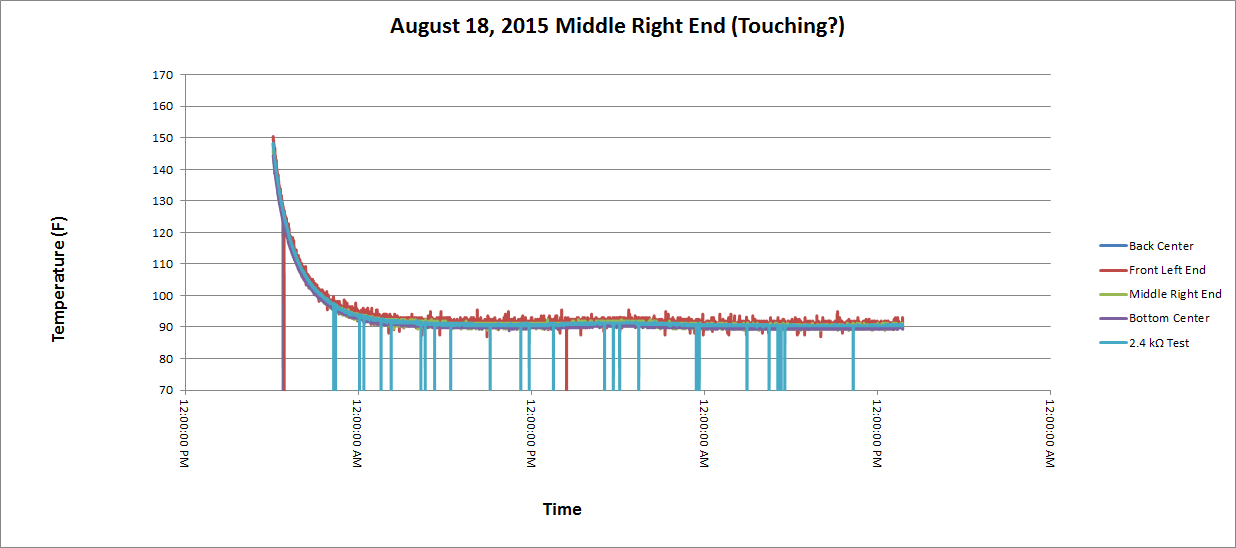
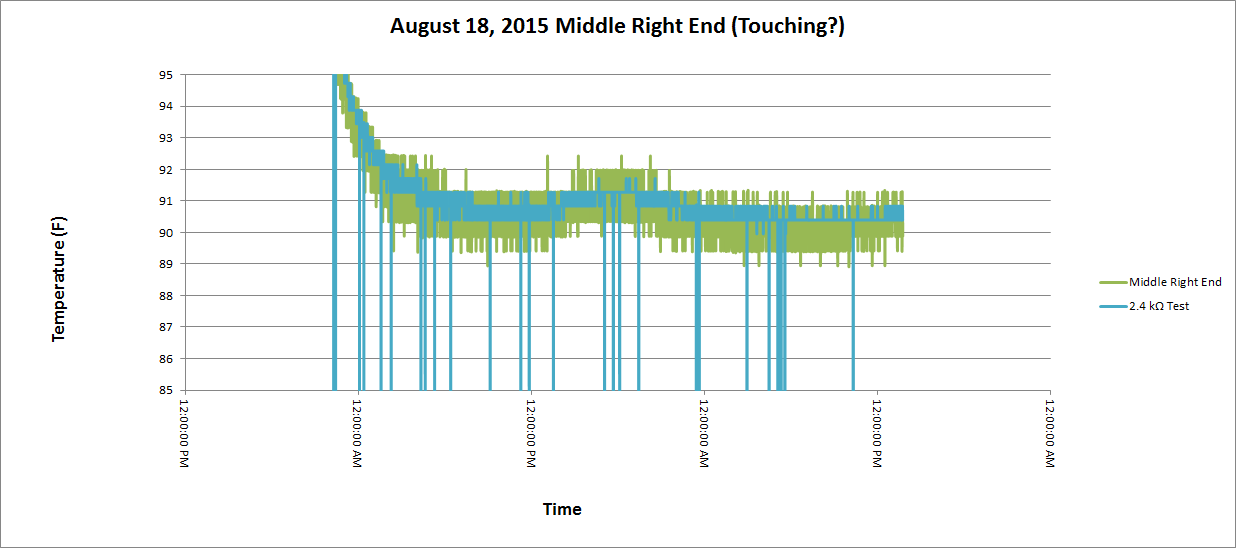
The test thermistor was at the middle right end. This run began immediately after the previous run ended, and the box did not completely cool.
Next Steps
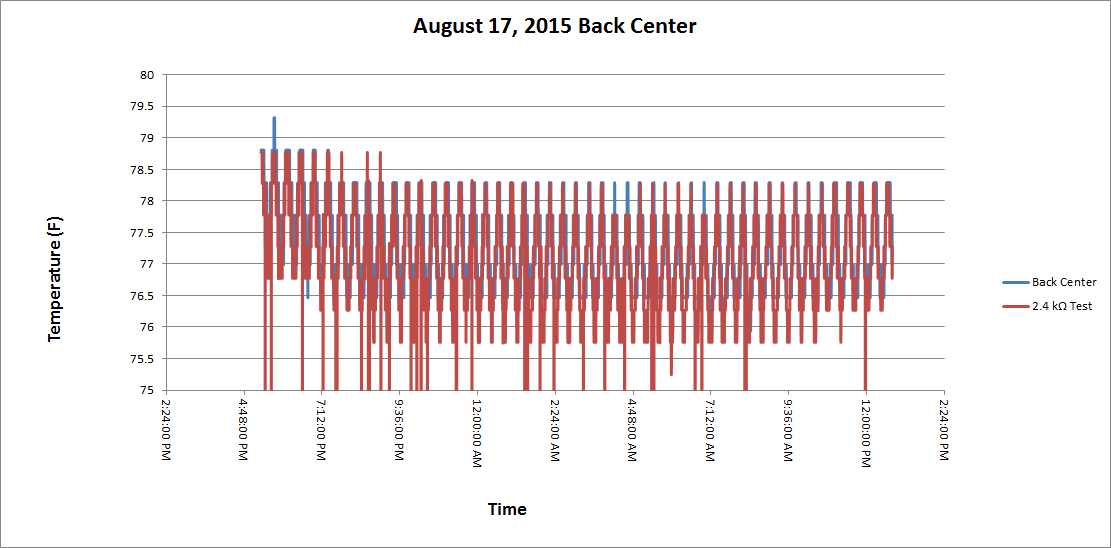
The current LabVIEW program sometimes records a zero or #NV in the temperature data file. We should change the program to so that it replaces a zero or NaN with the previous temperature. If a second zero or NaN occurs immediately after the first, LabVIEW should not replace the second one with another value.
