Difference between revisions of "Temperature Data from Fiber Heating"
Jump to navigation
Jump to search
| Line 58: | Line 58: | ||
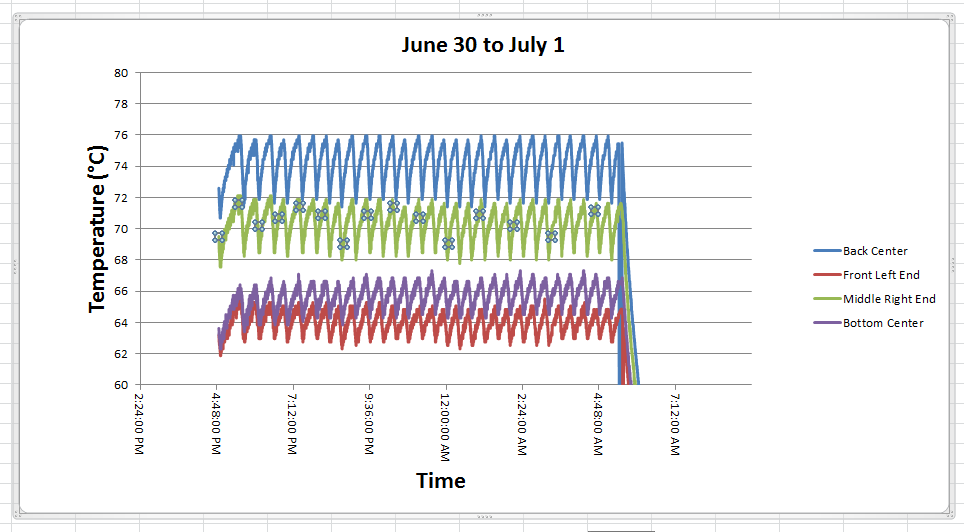
[[File:June 30 to July 1.png]] | [[File:June 30 to July 1.png]] | ||
| + | |||
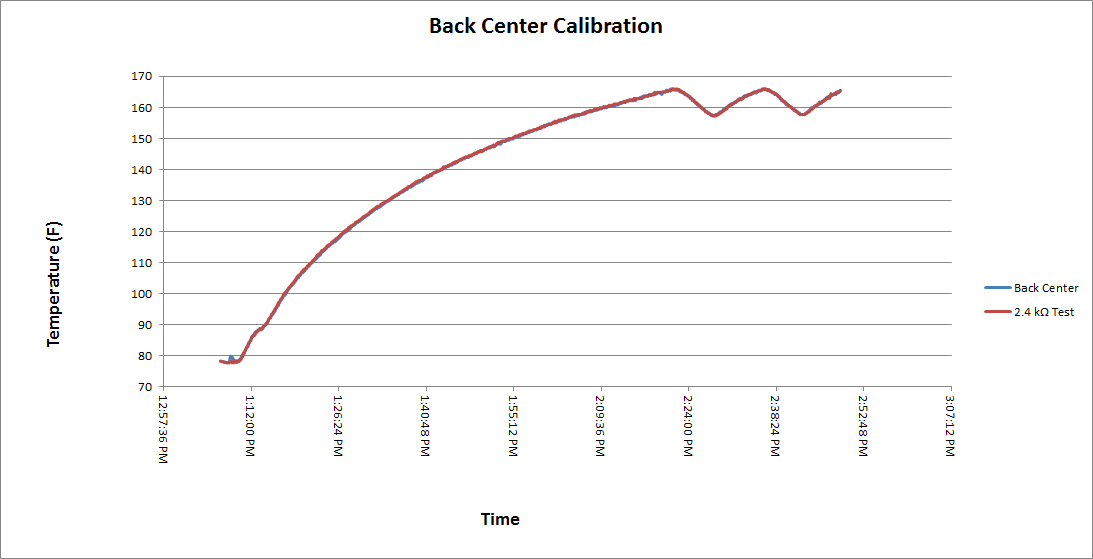
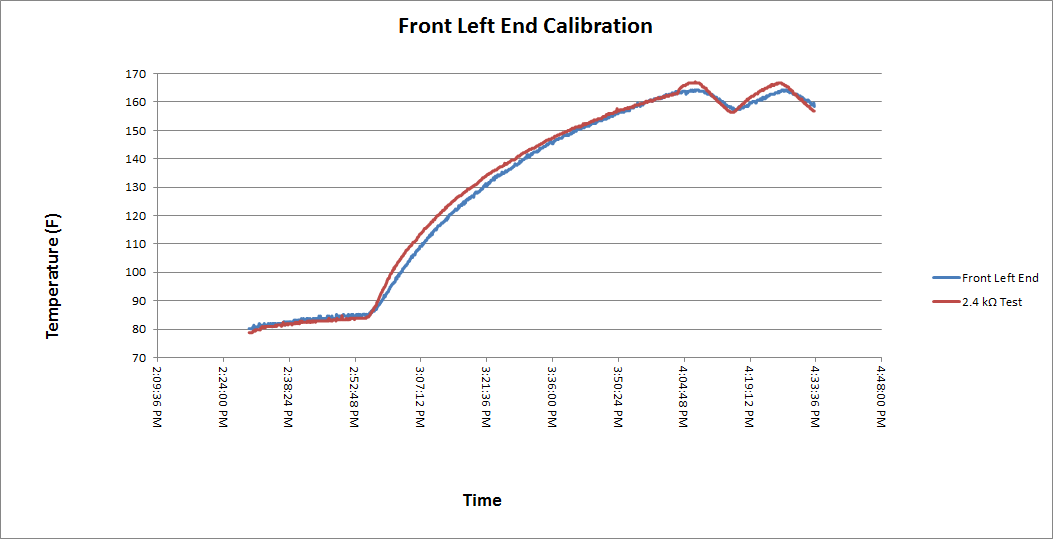
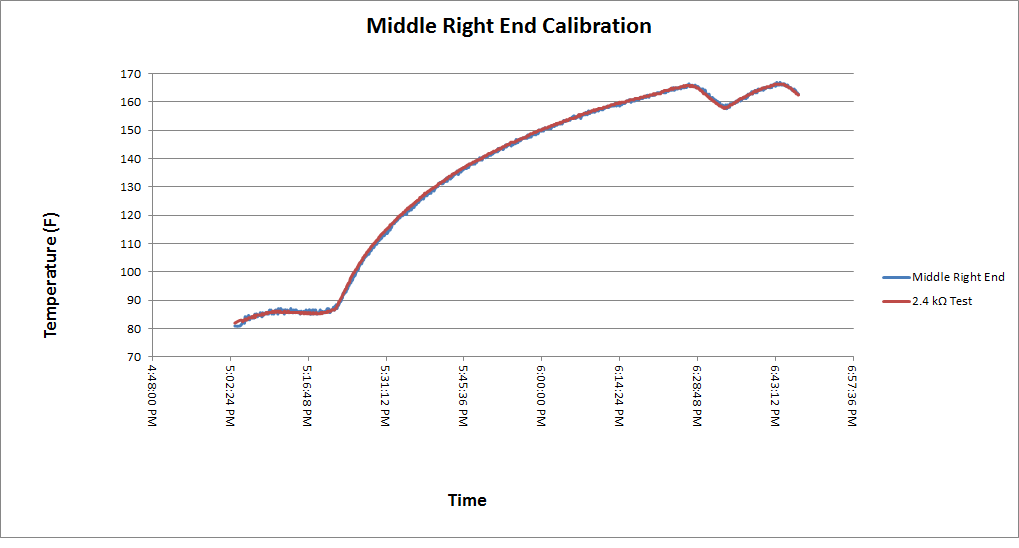
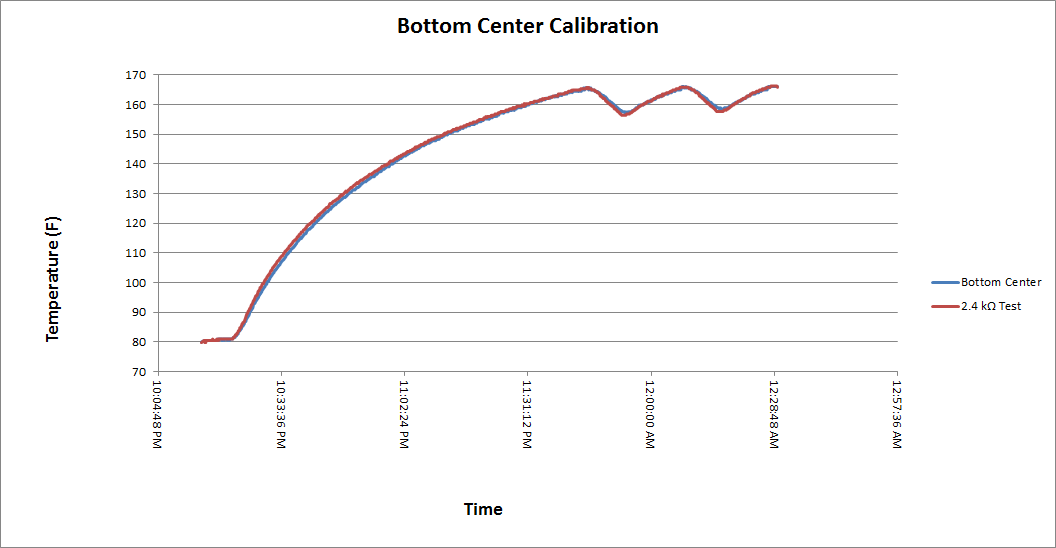
| + | =Calibration Graphs= | ||
| + | |||
| + | ==Back Center== | ||
| + | |||
| + | [[File:BWBackCenterCal8112015.png]] | ||
| + | |||
| + | ==Front Left End== | ||
| + | |||
| + | [[File:BWFrontLeftEndCal8112015.png]] | ||
| + | |||
| + | ==Middle Right End== | ||
| + | |||
| + | [[File:BWMiddleRightEndCal8112015.png]] | ||
| + | |||
| + | ==Bottom Center== | ||
| + | |||
| + | [[File:BWBottomCenterCal8112015.png]] | ||
Revision as of 21:39, 11 August 2015
Data Files
We will make available raw spreadsheet data files and edited files that include charts and summary information.
Summary Data and Graphs
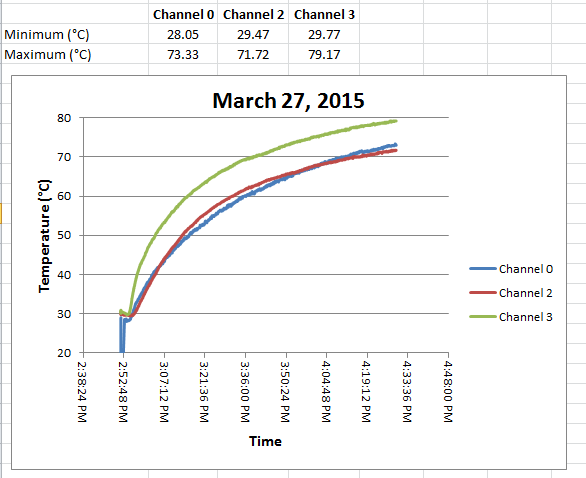
March 27, 2015
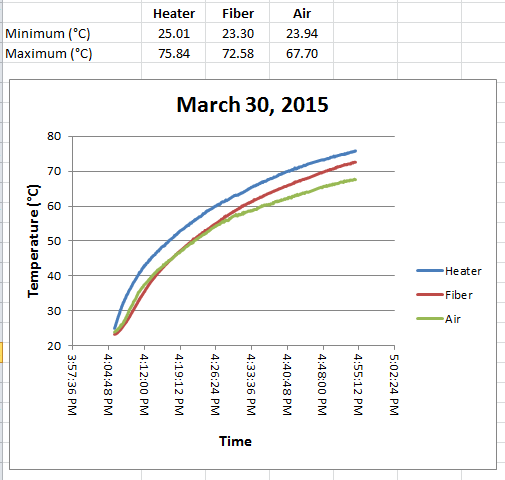
March 30, 2015
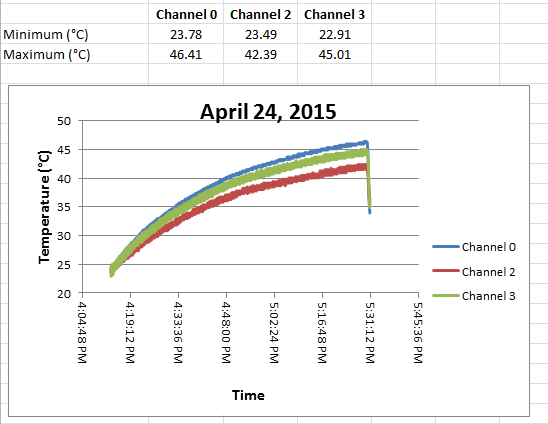
April 24, 2015
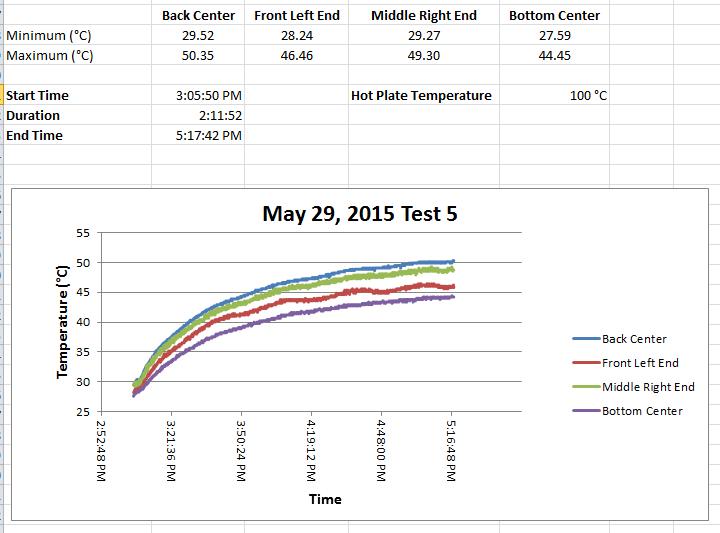
May 29, 2015 Test 5
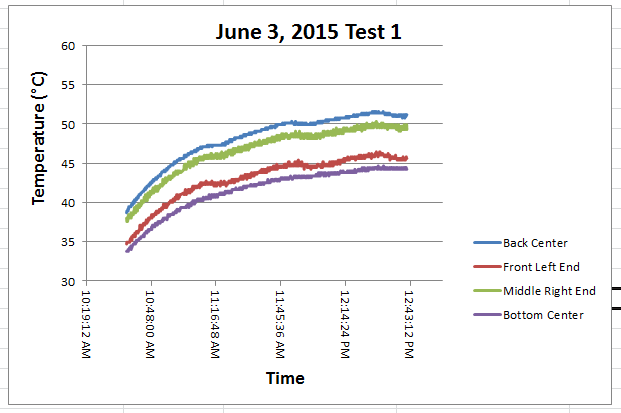
June 3, 2015 Test 1
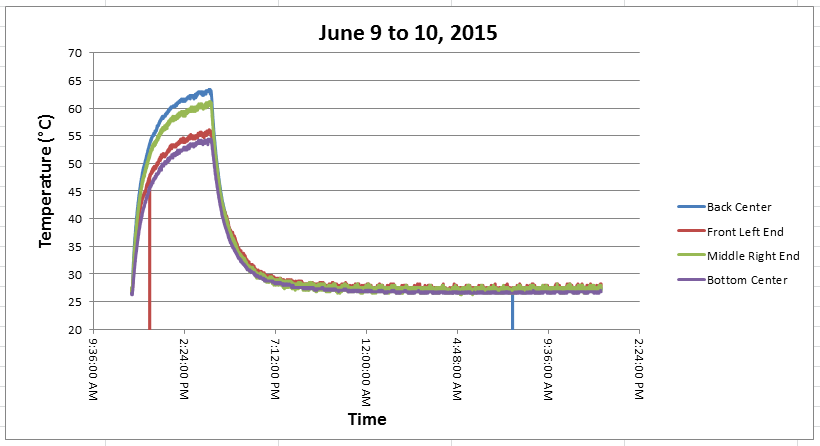
June 9-10, 2015
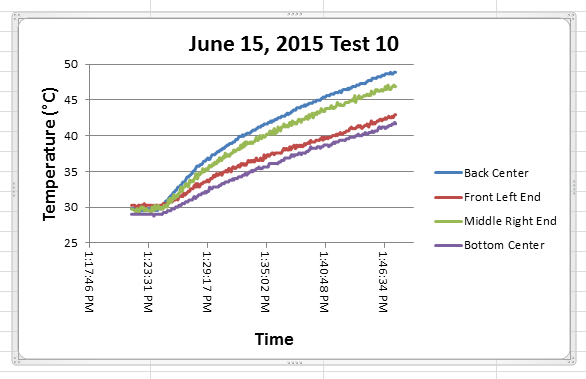
June 15, 2015 Test 10
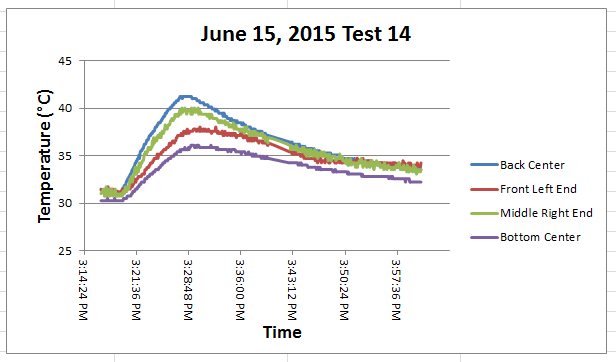
June 15, 2015 Test 14
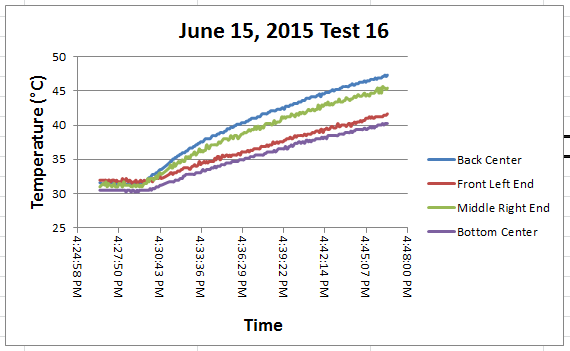
June 15, 2015 Test 16
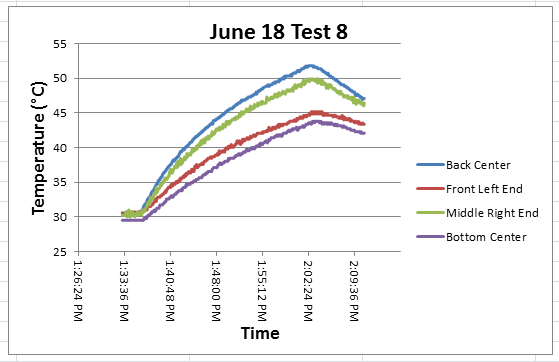
June 18, 2015 Test 8
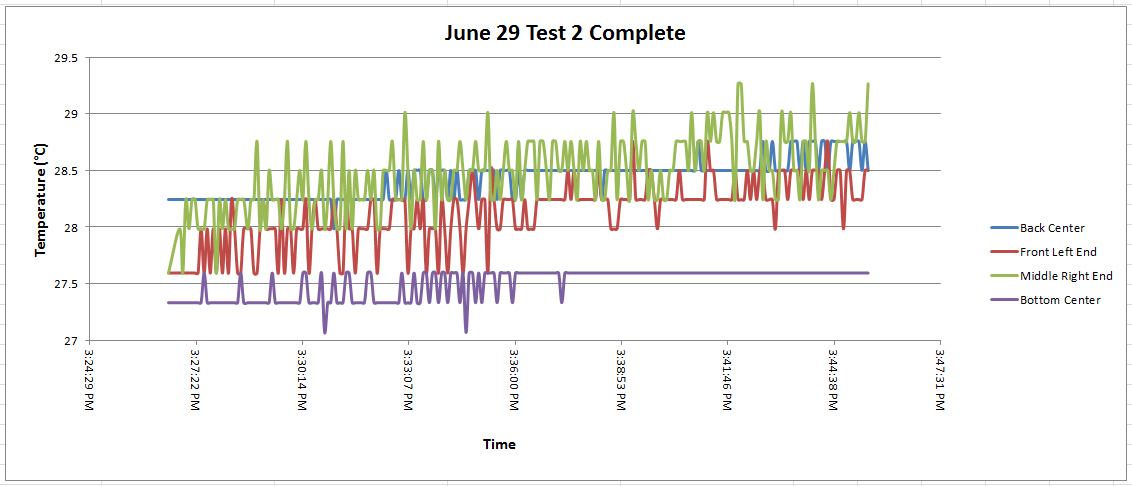
June 29, 2015 Test 2
The hot plate was off throughout this brief test to determine whether the thermistors agree at room temperature.
